


Understanding Conductor DC Resistance
Conductor DC resistance (Rdc) is the inherent opposition a conductor offers to the flow of direct current, converting electrical energy into heat via Joule heating (P = I²R). Governed by IEC 60228, it is the primary metric for determining a cable’s current-carrying capacity (ampacity) and efficiency. The standard reference temperature for measuring DC resistance is 20°C. It is inversely proportional to the cross-sectional area of the conductor and directly proportional to the material’s resistivity (ρ) and length (L). Minimizing DC resistance reduces voltage drop and thermal stress on insulation materials like XLPE or PVC.
Technical Parameter Matrix: Material & Temperature Specifications
The following data matrix outlines the technical limits, resistivity constants, and temperature coefficients for standard industrial conductors according to IEC 60228 and BS 6360.
| Technical Parameter | Plain Annealed Copper (Class 1 & 2) | Metal-Coated Copper (Tinned) | Aluminum Alloy (Class 2) |
| Volume Resistivity (ρ) at 20°C | ≤ 0.017241 Ω·mm²/m | ≤ 0.017774 Ω·mm²/m | ≤ 0.028264 Ω·mm²/m |
| Conductivity (% IACS) | 100% | 97% – 99% | 61% |
| Temperature Coefficient (α₂₀) | 0.00393 per °C | 0.00393 per °C | 0.00403 per °C |
| Maximum Operating Temp (XLPE) | 90°C | 90°C | 90°C |
| Maximum Operating Temp (PVC) | 70°C | 70°C | 70°C |
| Short-Circuit Temperature Limit | 250°C | 250°C | 250°C |
Standard Operating Procedure: Verifying Conductor DC Resistance
Follow this standardized quality testing workflow to measure and verify DC resistance during manufacturing compliance or field commissioning.
- Prepare the Sample Length: Cut a minimum cable sample of 1 meter (excluding ends). Ensure the conductor faces are clean, free of oxidation, and properly exposed.
- Stabilize Ambient Temperature: Condition the sample in a temperature-controlled testing room at 15°C to 25°C for at least 12 hours. Record the exact ambient temperature (t) using a calibrated thermometer accurate to ±0.1°C.
- Calibrate the Micro-ohmmeter: Utilize a calibrated 4-wire Kelvin bridge or digital micro-ohmmeter to eliminate test lead resistance.
- Execute the Measurement: Connect the current and potential clips to the conductor. Apply the test current and record the measured resistance (Rₜ).
- Normalize to 20°C standard: Convert the measured resistance to the standard 20°C value using the formula:R20 = Rt × 254.5 / (234.5 + t) (Note: Use 228 instead of 234.5 for aluminum conductors).
- Pass/Fail Alignment: Compare the calculated R₂₀ against the maximum allowable values specified in IEC 60228 Table 1 or Table 2 for the corresponding nominal cross-sectional area.
Core Determinants of Conductor DC Resistance
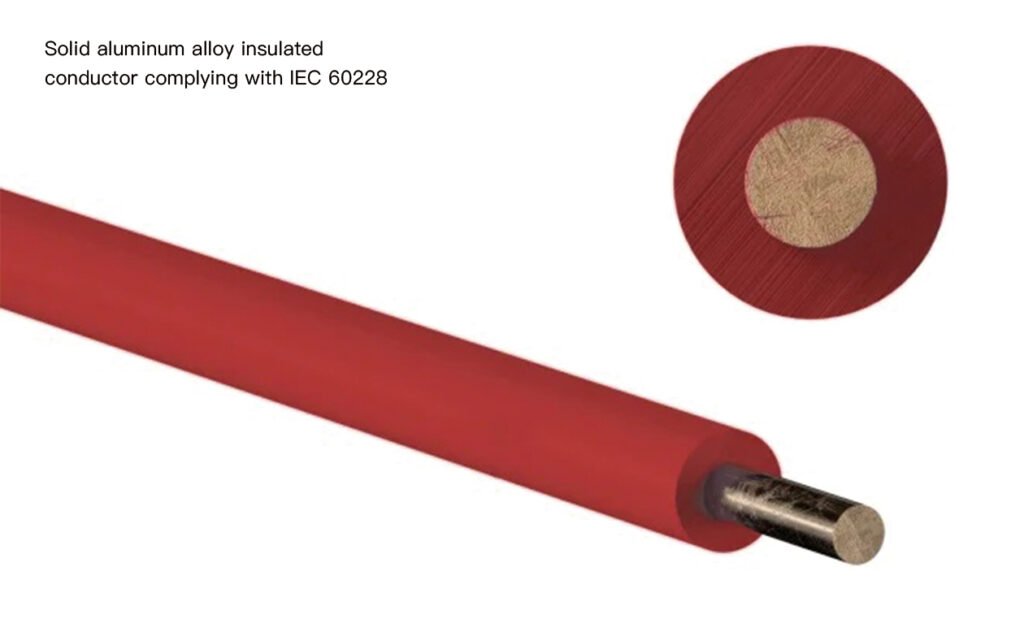
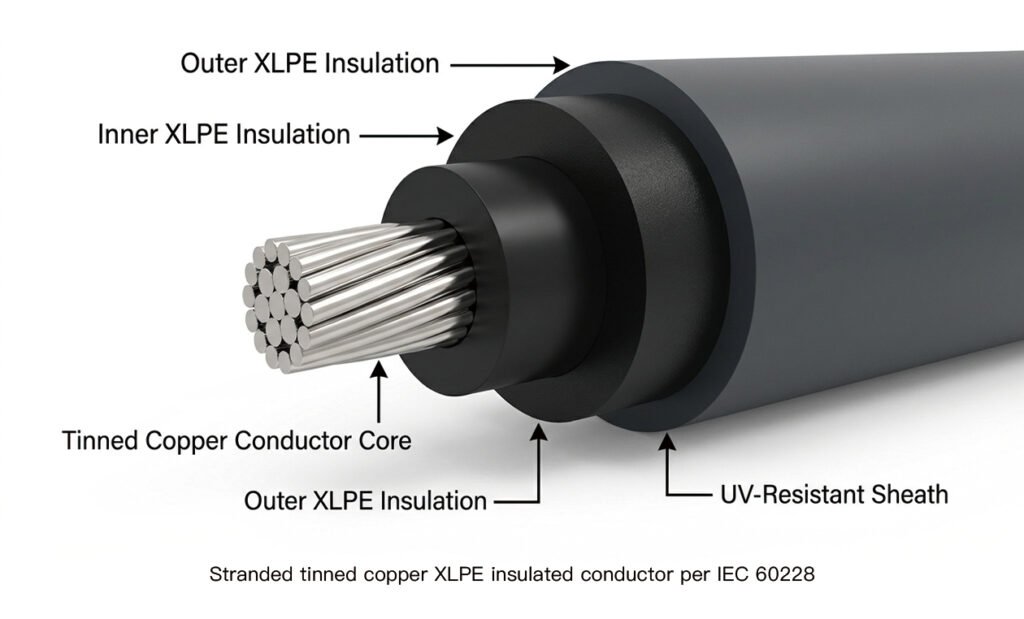
Material Composition and Purity
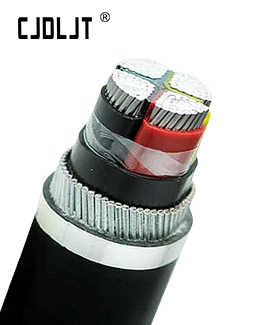
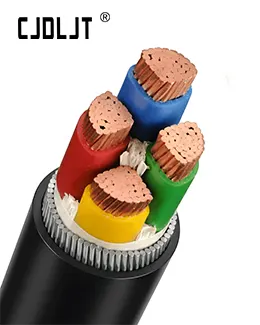
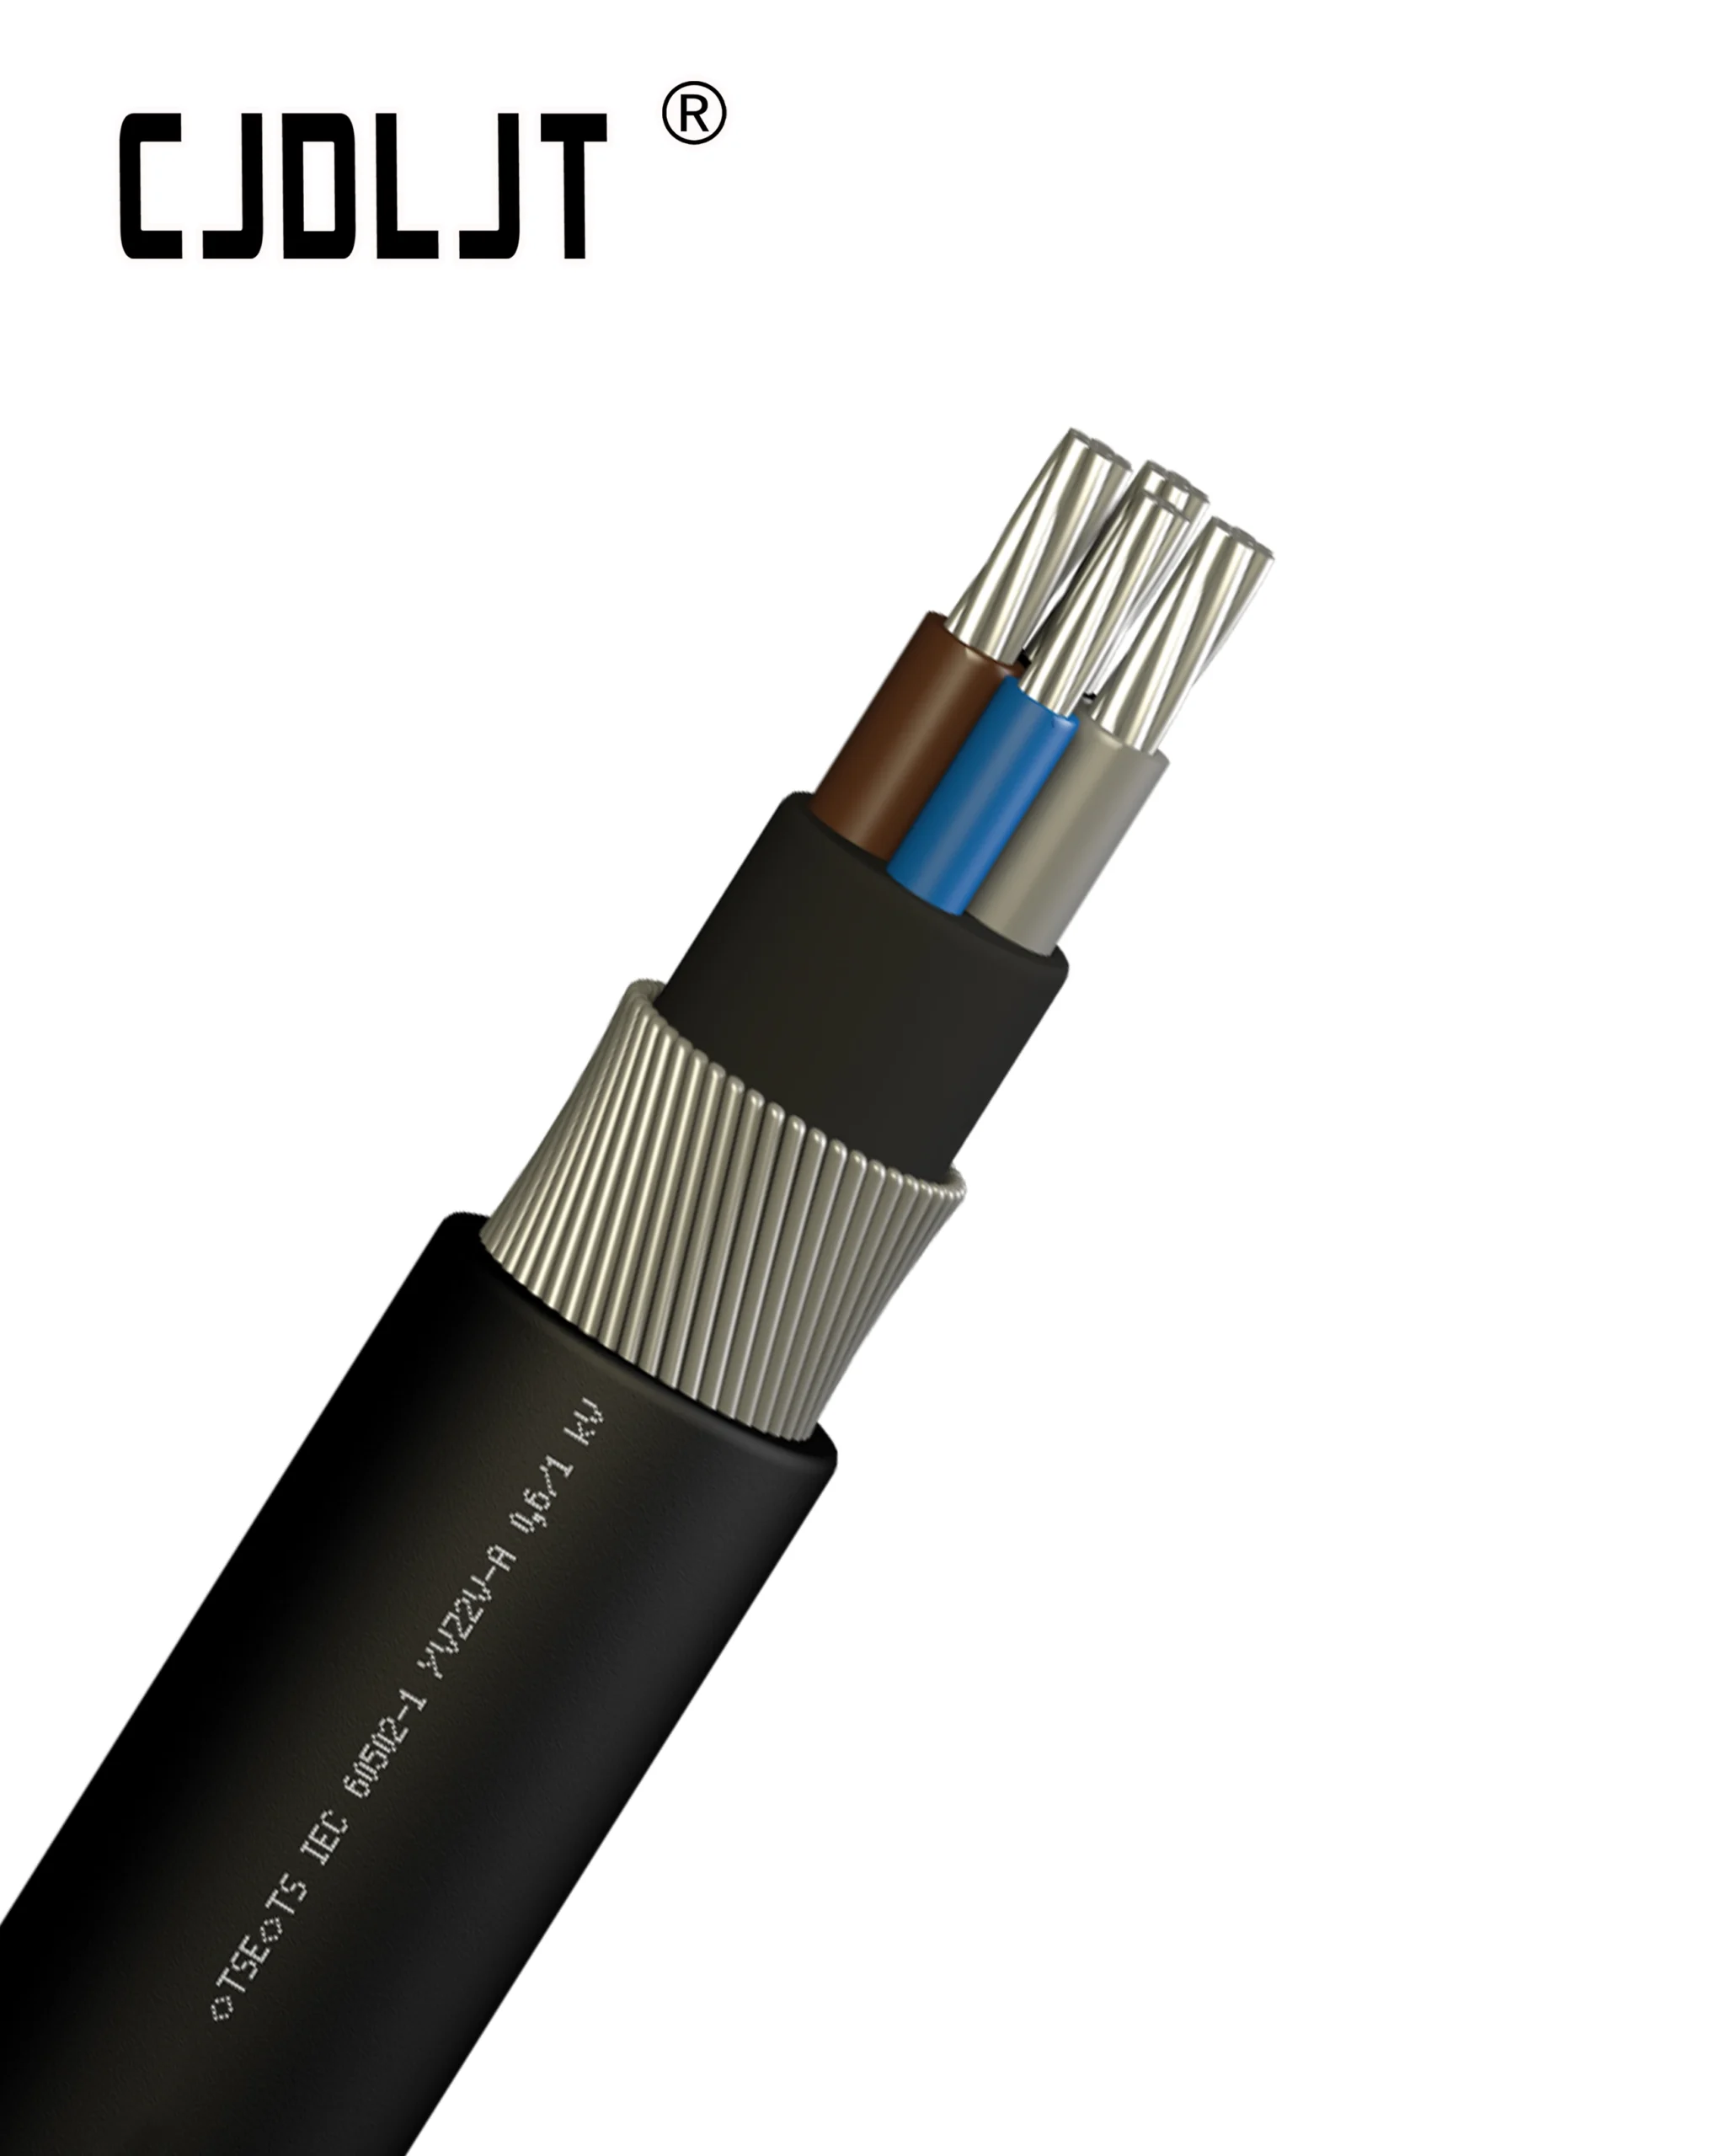
The electrical resistivity (ρ) of the base metal dictates the baseline DC resistance. Plain Annealed Copper is the industry benchmark due to its high purity and optimal grain structure. Tinned Copper increases resistance slightly but prevents oxidation in corrosive or high-temperature environments. Aluminum Alloy possesses higher intrinsic resistance, requiring a larger nominal cross-sectional area to match the ampacity of copper.
Temperature Dependencies
DC resistance increases linearly with temperature. As current flows, power dissipation elevates the conductor temperature from ambient up to its maximum rated limits (70°C for PVC, 90°C for XLPE).
The operational resistance (Rθ) at an elevated temperature θ must be calculated using the temperature coefficient of resistance (α):
Rθ = R20[1 + α₂₀(θ − 20)]
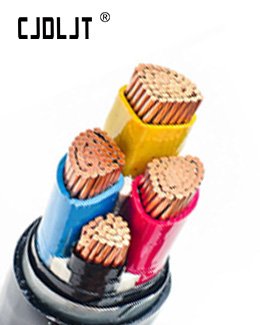
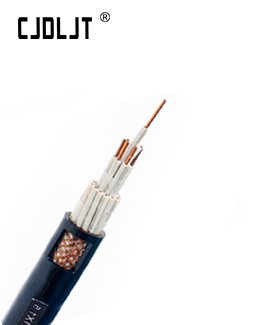
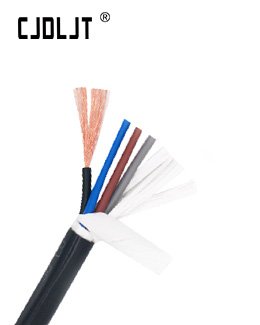
Conductor Stranding and Geometry
Solid conductors (Class 1) exhibit lower DC resistance than stranded (Class 2) or flexible (Class 5/6) conductors of the same nominal cross-sectional area. This discrepancy occurs because stranding introduces a “lay factor”—the helical winding increases the actual path length of the current relative to the linear length of the finished cable assembly, marginally increasing total DC resistance.